Main menu - Tools
Linearized Phase Diagrams
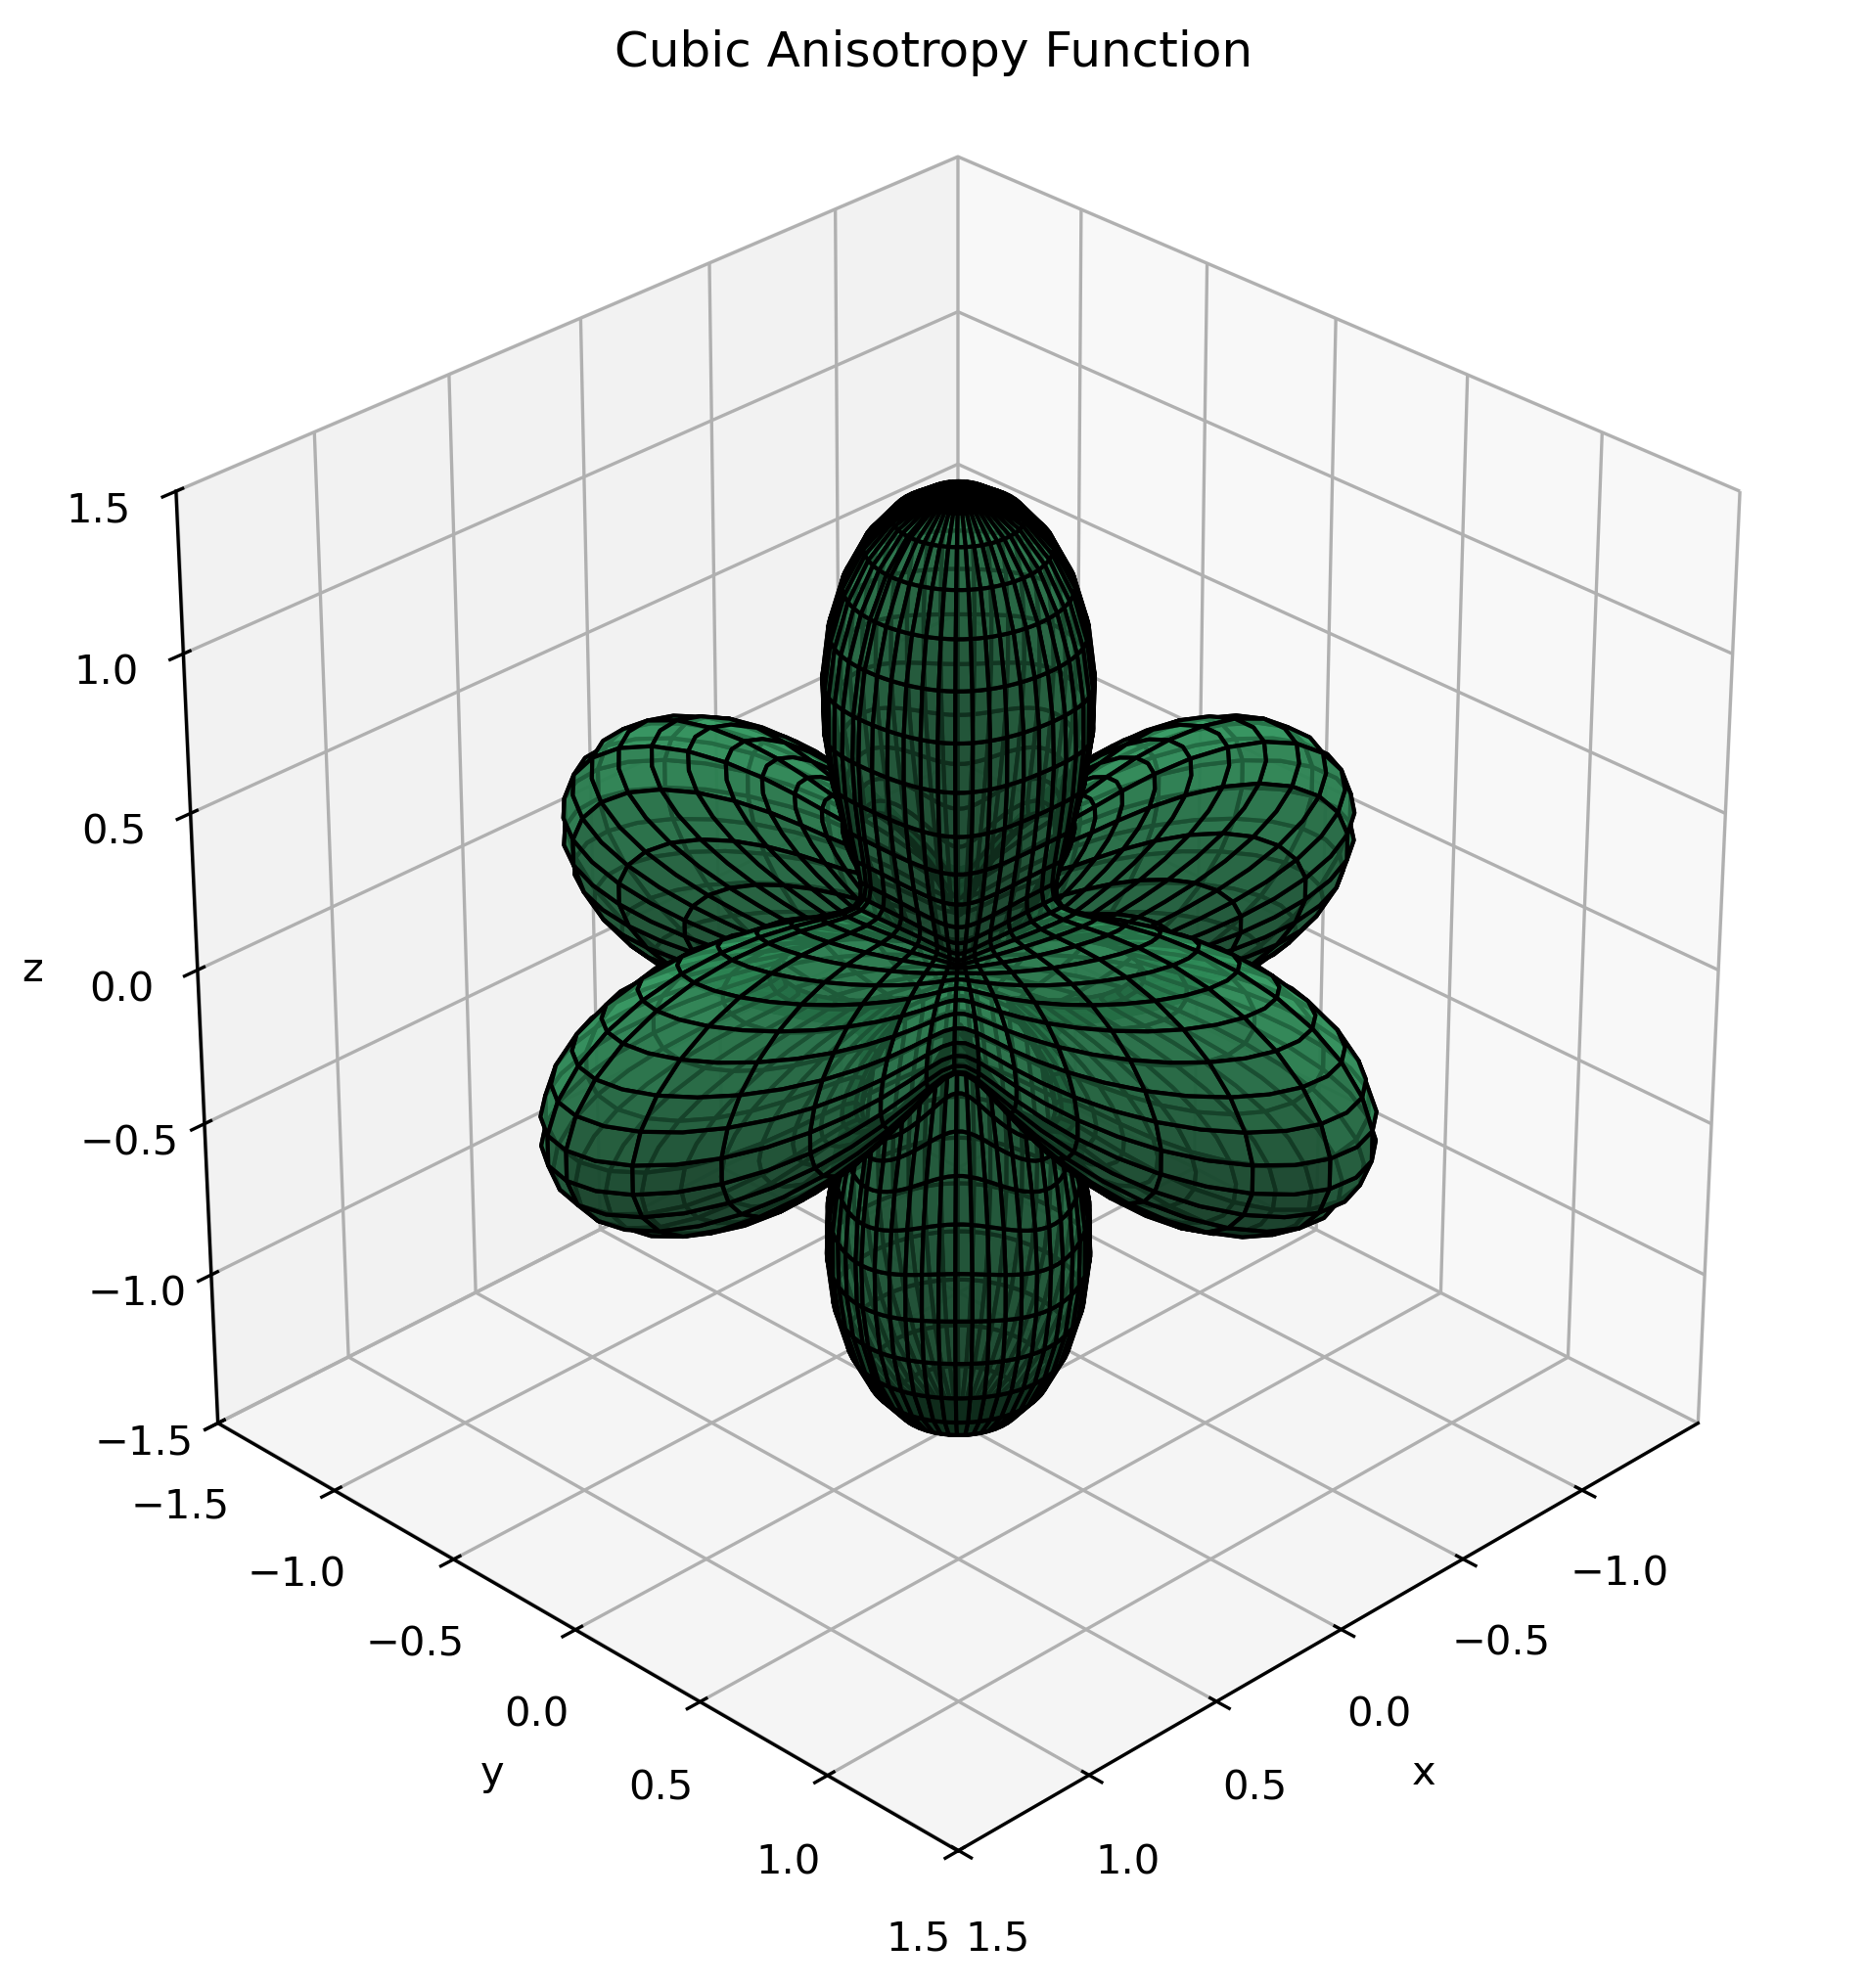
Linearized phase diagrams can be plotted as a draft. The parameter will be taken from the current driving file. This is possible when no database is used.
The phase diagram of the FCC/BCC interaction for component MN used in example T02_20_FeCMn_E_GammaAlphaIsotherm_2D_Lin
2D Anisotropy Plot
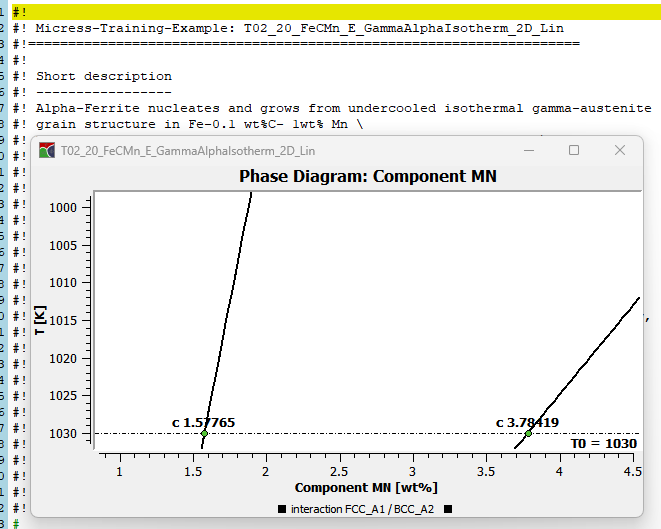
The anisotropy of interfacial stiffness and mobility can be set for each phase interaction in the driving file. The tool '2D Anisotropy' visualizes the anisotropy functions for some of the possible crystal symmetry combinations. This should ease definition of the coefficent parameter.
2D Anisotropy function for the liquid (isotropic) / solid (cubic) phase interaction
If parameter in the driving file are changed, it is necessary to save the file and open the plot again to see the visualized changes.
3D Anisotropy Plot
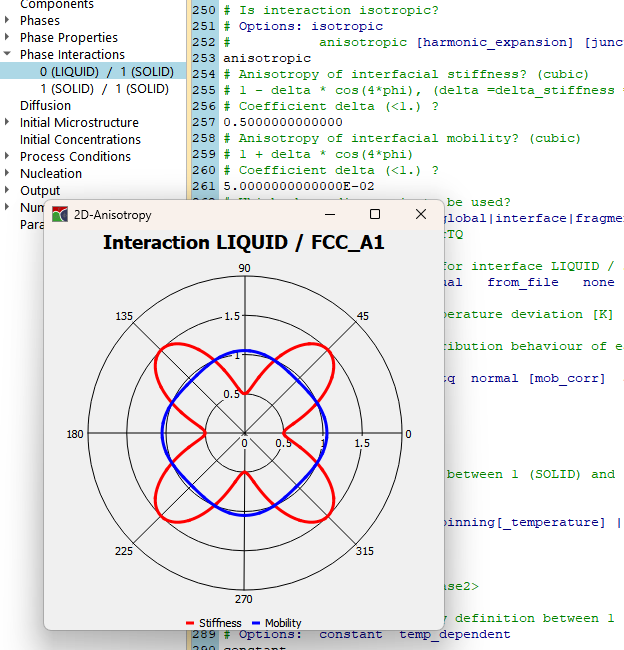
The 'anisotropie.py' Python script in the MICRESS Tools directory implements a browser based app with the Python framework 'Streamlit' to show 3D anisotropy functions.
If the MICRESS installation includes the MCIRESS Python distribution, MICpad will start this app directly in the local standard browser. There might be a firewall confirmation necessary to use the TCP/IP protocol locally. Here, the private domain is sufficient.